Page 42 - GS170902
P. 42

ISOMetrics


        Connected-consumer commerce trends                     Connected commerce preferences, patterns:


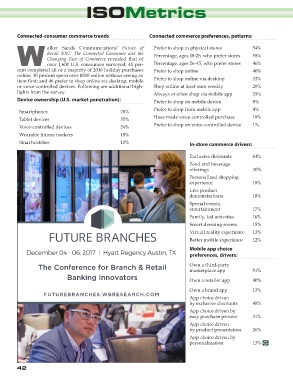
                     alker Sands Communications'  Future of      Prefer to shop in physical stores         54%
                     Retail 2017: The Connected Consumer and the   Percentage, ages 18-25, who prefer stores   58%
                     Changing Face of Commerce revealed that of
        W over 1,600 U.S. consumers surveyed, 41 per-            Percentage, ages 26-45, who prefer stores   46%
        cent completed all or a majority of 2016 holiday purchases   Prefer to shop online                 46%
        online, 30 percent spent over $500 online without seeing an
        item first; and 46 prefer to shop online via desktop, mobile   Prefer to shop online via desktop      33%
        or voice-controlled devices. Following are additional high-  Shop online at least once weekly      29%
        lights from the survey.                                  Always or often shop via mobile app       29%
        Device ownership (U.S. market penetration):              Prefer to shop on mobile device           8%

         Smartphones                               78%           Prefer to shop from mobile app            4%
         Tablet  devices                           55%           Have made voice-controlled purchase       19%
         Voice-controlled  devices                 24%           Prefer to shop on voice-controlled device   1%
         Wearable fitness trackers                 18%
         Smartwatches                              13%                          In-store commerce drivers:


                                                                                Exclusive discounts        64%
                                                                                Food and beverage
                                                                                offerings                  30%
                                                                                Personalized shopping
                                                                                experience                 18%
                                                                                Live product
                                                                                demonstrations             18%
                                                                                Special events,
                                                                                entertainment              17%
                                                                                Family, kid activities     16%
                                                                                Smart dressing rooms       15%
                                                                                Virtual reality experience   13%
                                                                                Better mobile experience   12%
                                                                                Mobile app choice
                                                                                preferences, drivers:

                 The Conference for Branch & Retail                             Own a third-party          51%
                                                                                marketplace app
                             Banking Innovators                                 Own a retailer app         40%


                                                                                Own a brand app            13%
                   FUTUREBRANCHES.WBRESEARCH.COM
                                                                                App choice driven
                                                                                by exclusive discounts     48%
                                                                                App choice driven by
                                                                                easy purchase process      31%
                                                                                App choice driven
                                                                                by product presentation    26%
                                                                                App choice driven by
                                                                                personalization            13%


        42
        42
   37   38   39   40   41   42   43   44   45   46   47